
Why TensorRT Is Not Your Biggest Latency Problem
From Camera DMA to Control Commands: Where your milliseconds really go?

A robotics engineer spends a week converting a model to TensorRT - fusing layers, tuning kernels, enabling FP16, maybe running INT8 calibration. The benchmark looks great: inference drops from 20ms to 18ms. They deploy it expecting the robot to feel noticeably sharper.
It doesn’t. The robot still reacts late, still misses fast-moving objects, still feels a beat behind in closed-loop operation.
TensorRT didn’t fail. Inference was never the biggest latency problem to begin with - it’s just the only one anyone bothered to measure.
That’s the strange thing about robotics perception pipelines in 2026: the neural network is usually the most heavily optimized component in the entire chain, and almost everything around it is still running on default settings from three years ago.
Here’s what actually happens between a photon hitting the sensor and a steering command reaching the wheels:
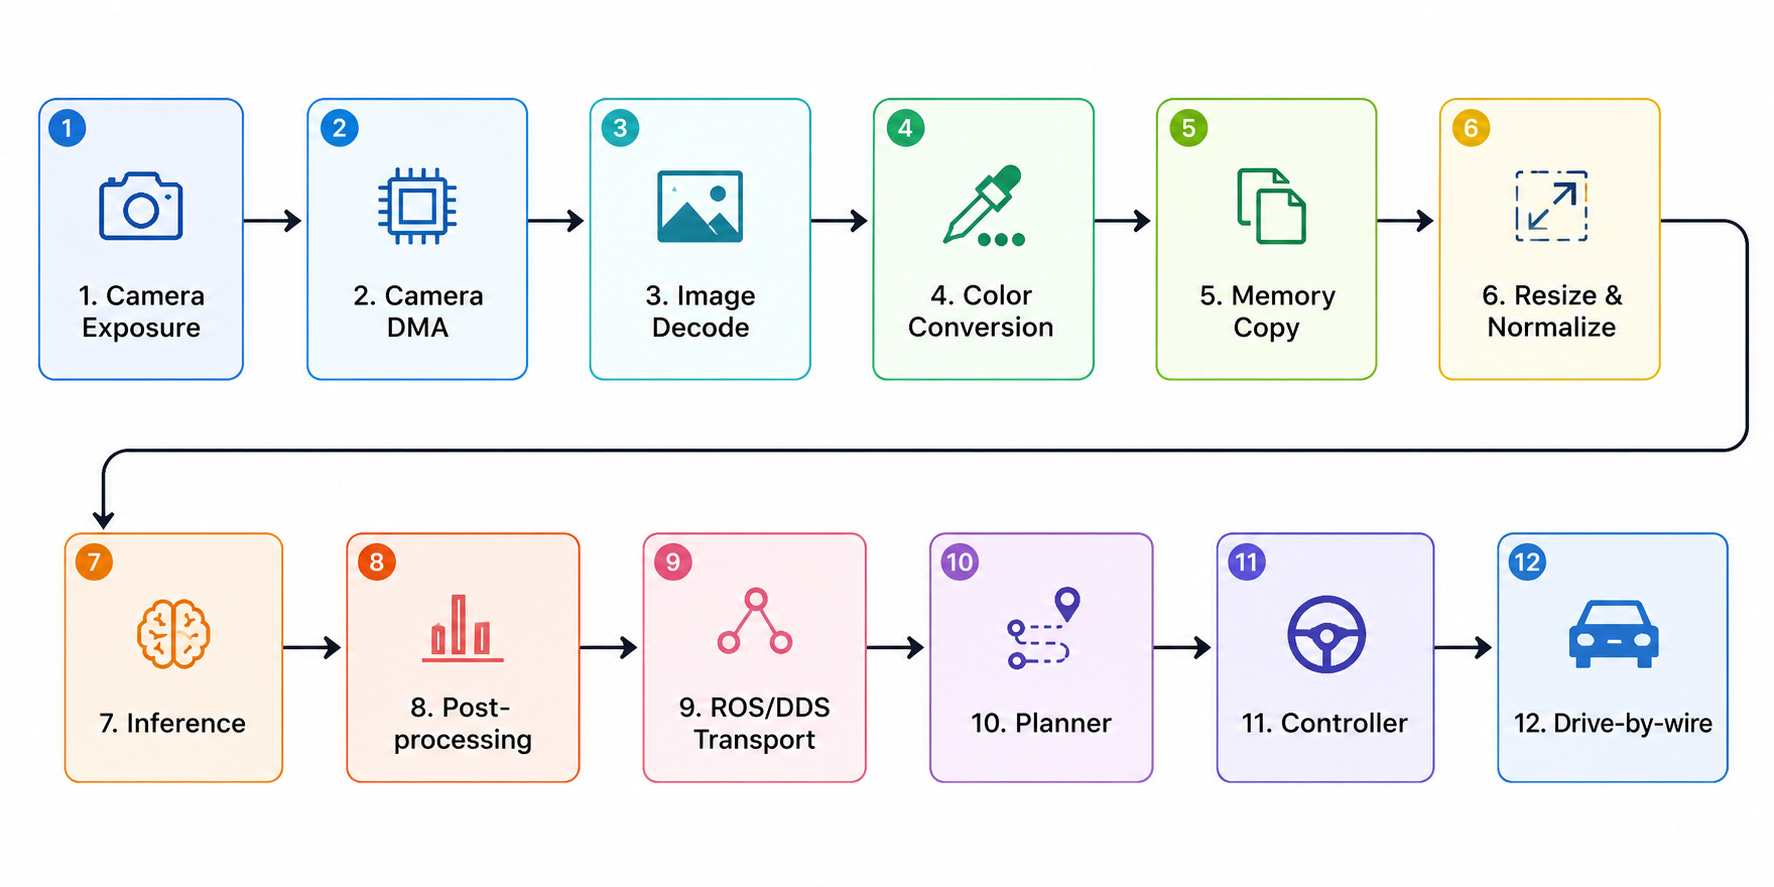
Most benchmark decks show one box from this chain. The other eleven don’t make it into the slide.
Take a real profile - an engineer reports 18ms inference and feels good about it. Then someone times the whole pipeline:
Camera DMA              8 ms
Image decode            4 ms
Color conversion        3 ms
Memory copies           5 ms
Resize & normalize      5 ms
Inference               18 ms
NMS                     7 ms
ROS publish             6 ms
Controller interface    4 ms
------------------------------
Total                   60 ms
Now the same pipeline after several weeks of TensorRT work:
Camera DMA               8 ms
Image decode             4 ms
Color conversion         3 ms
Memory copies            5 ms
Resize & normalize       5 ms
Inference                16 ms
NMS                      7 ms
ROS publish              6 ms
Controller interface     4 ms
--------------------------------------------
Total                    58 ms
Two milliseconds saved, on a pipeline that’s still burning over 40ms on everything that isn’t the model. Most of the engineering hours went into the smallest slice of the problem.
Why often teams still ignore it?
It’s not carelessness - it’s tooling. TensorRT ships with profilers. CUDA has timelines. Every framework spits out an inference number, and every paper leads with one. The rest of the pipeline is scattered across drivers, middleware, the OS scheduler, and hardware interfaces that were never built to be measured together. Getting an honest end-to-end number means stitching timestamps across four or five layers of the stack by hand, and almost nobody does that work.
So teams optimize what they can see. It’s a completely rational response to bad visibility - it’s just optimizing the wrong thing.
- Memory copies are where a lot of latency hides.
One of the least glamorous parts of a perception pipeline is how many times an image gets copied before the GPU ever sees it:
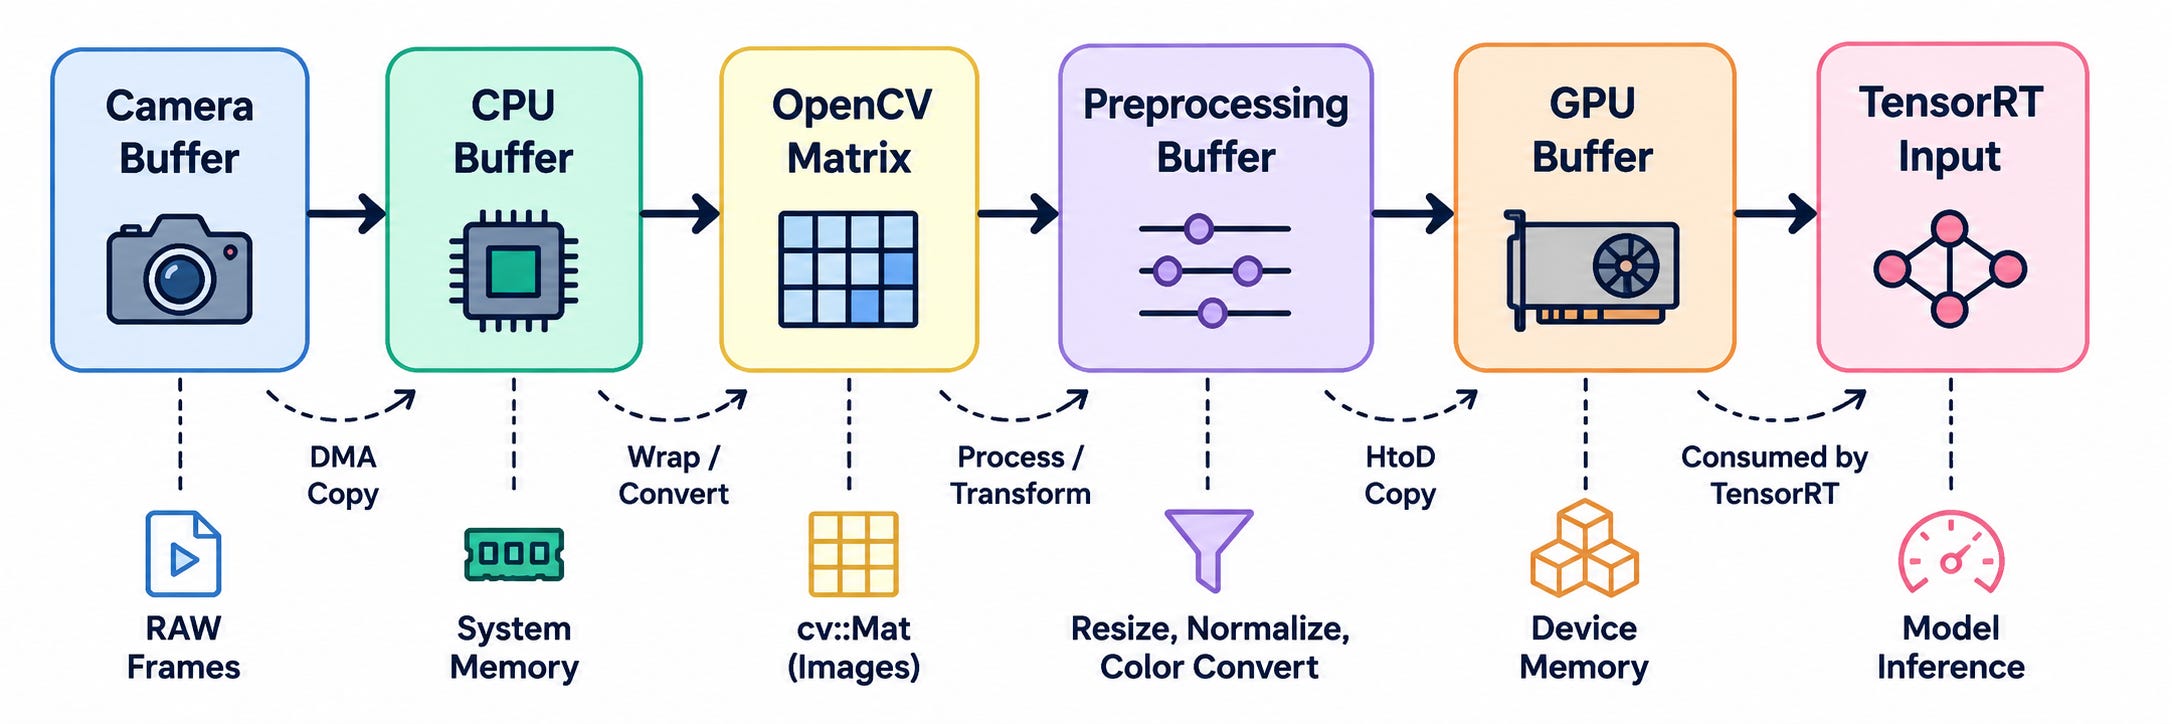
Every hop costs time and bandwidth, and none of it improves the prediction by a single percentage point. I’ve seen teams cut more latency by removing one unnecessary copy than by dropping from FP32 to FP16 - and that fix never shows up in a conference talk, because there’s no leaderboard for “deleted a memcpy.”
- Cameras aren’t really instant.
“Camera latency” gets treated as basically zero, which is wrong. Sensor exposure, readout, DMA transfer, driver buffering, synchronization - all of that happens before a single pixel reaches software. If exposure alone costs 10ms, no amount of TensorRT tuning gets those milliseconds back. You can’t infer on pixels that haven’t arrived yet.
Preprocessing eats time too - resizing, RGB conversion, normalization, undistortion, stereo rectification. None of it touches the model, all of it happens before the model runs, and on a lot of setups the GPU actually finishes inference before the CPU has fed it the next frame. Utilization looks low and everyone blames the model, when the model’s been sitting idle waiting on preprocessing the whole time.
- Middleware and the scheduler take a major cut.
Most robotics stacks aren’t one process - messages get serialized, copied, queued, deserialized, and rescheduled as they move through ROS or DDS. Each hop is a few milliseconds. Six here, four there, a context switch somewhere else, and the robot is reacting 30ms later than the raw compute numbers would suggest. No amount of model optimization touches any of that.
The OS scheduler adds its own tax. Perception finishes a frame, but the controller doesn’t necessarily run next - logging might be flushing, a background thread might wake up, a network interrupt might steal a few cycles. Average latency barely moves, but worst-case latency can blow out badly. And for a physical robot, worst case usually matters more than average: a car that responds in 20ms most of the time but occasionally stalls for 80ms is more dangerous than one that’s a steady, boring 40ms every time. Determinism beats raw speed.
Even after perception is done, the command still has to pass through safety checks, interface layers, the CAN bus, motor controllers, and firmware before anything physically moves. The robot is always acting on slightly stale information - the only question is how stale.
How should one approach benchmarking?
Instead of asking “how fast is our model?”, the better question to ask us is “how old is the information by the time the actuator receives it?”
That single number - call it perception-to-action latency - captures camera time, preprocessing, inference, middleware, scheduling, planning, and control all at once. It’s what the robot actually experiences. The robot has no idea whether 20ms disappeared inside TensorRT or inside a memcpy; it only knows when the command arrived.
The most useful exercise I’ve found is building a real waterfall chart per frame:
Camera Exposure        ██
DMA                    ███
Decode                 ██
Color Conversion       █
Memory Copies          ██
Preprocessing          ██
Inference              ███████
Post-processing        ███
ROS/DDS                ██
Planning               ███
Controller             ██
Once you actually look at the full bar, it’s obvious where the effort should go. Sometimes it really is the model. More often, it isn’t.
TensorRT is genuinely excellent engineering - but its own visibility has created a blind spot. Because inference is the easiest thing to profile, it becomes the thing everyone obsesses over, while camera pipelines, memory movement, scheduling, and controller interfaces quietly eat the rest of the budget with nobody watching.
The fastest robots don’t come from the teams with the fastest models. They come from the teams that’ve bothered to account for every millisecond between the sensor and the actuator.